Questionnaire and Graphs
In
order to gain a sufficient understand of what the audience’s viewpoints and demands
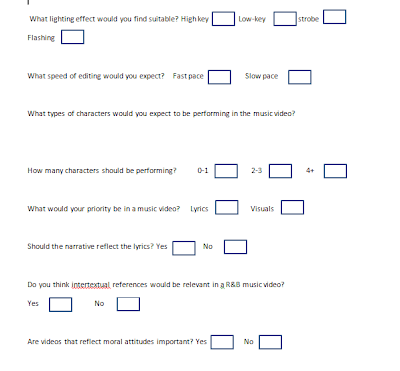
from an R&B music video I carried out a questionnaire that consisted of 21 questions and then then put the feedback into graph form.
The purpose of doing this was to make me understand clearly what makes a
target audience enjoy and listen to the genre of my choice (R&B). I would then
be able to use this information and decide on what I should use and what I should
not use when producing my music video
product.
Feedback:
What is this graph
showing?
This graph shows that 16 people answered yes to enjoying R&B
music and 4 answered no out of the 20
people I asked.
How has this helped
you make decisions about your product?
I knew that R&B is a popular genre that people would
enjoy listening to.
What is this graph
showing?
How important the Star image of an R8B artist is to the
audience. 18 people answered yes,
whereas only 2 had answered no.
How has this helped
you make decisions on your product?
We would put more emphasis on the star image of our artist
and how they would be portrayed to the audience.
What is this graph
showing?
The four main star images that could be evident in a R&B
music video. 10 people had said the
artist should have a sexy star image, 4 said cool, also 4 said controversial
and 2 said political.
How has this helped
you make decisions about your product?
A conventional artist in the R&B genre would have a ‘sexy’
star image in which they prioritise their image and looks in the music video.
This also appeals to the audience of the R&B genre.
What is this graph
showing?
The different types of costume that could be included in the
music video. The majority of 9 had said casual clothing, 4 had said smart,
likewise 4 said urban and 3 had said hipster.
How has this helped
you make decisions about your product?
The audience would expect more of a casual clothing, however
the outcome was quiet broad as some opinions had been varied.
What is this graph showing?
8 people had picked both the love
and relationships themes whereas 3 picked fighting and 1 picked other.
How has this helped you make decisions about your product?
We should include both the love
and relationship theme to appeal and satisfy to the target audience as they
both are equal in importance.
What is this graph
showing?
The house location and urban setting being the most popular
with 8 people answering yes, and the studio and bar location got 2 people
saying yes each.
How has this helped
you making decisions about your product?
It is important to have different locations throughout the music
video, and the urban and house setting would for sure be a part of our music
video.
What is this graph showing?
This graph shows 17 people would
not expect to see instruments in an R&B video, whereas 3 people would.
How has this helped you make decisions about your product?
Including instruments would not be conventional to include
in a R&B video and would go against what the audience would expect in our
music video.
What is this graph
showing?
Low-key lighting is the most suitable to use in a R&B
music video as 11 people picked low-key.
5 had picked high-key, 3 had picked flashing and 1 had picked strobe.
How has this helped
you make decisions about your product?
Low-key lighting should be used in our music video and maybe
aspects of some high-key lighting too. There shouldn’t be other lighting
effects such as flashing or strobe.
What is this graph
showing?
12 people had said that two-three characters should be
performing, 7 had said four and above should be performing and only one had
said zero to one.
How has this helped
you make decisions about your product?
We can now determine roughly the amount of characters that
we would need to use in our music video and two to three would most likely be
what we would use.
What is this graph
showing?
9 people prioritising the lyrics over and visuals and 11
people prioritising the visuals over the lyrics.
How has this helped
you make decisions about your product?
We would have to build a relationship between the lyrics and
visuals as we can see both elements are really important to the audience.
From the questionnaire and feedback that I carried out and obtained I could now produce my music video according to the information I gathered. This would be a major contributing factor to the success of my music video because I would meet the demands of the target audience. I have taken all the feedback into account and would take it into serious consideration in producing my music video.


Onat, some fantastic research here on gathering information about your muic video. The questions you ask are relevant and have clearly helped you make decisions about your potential music video which can be seen in your graph analysis.
ReplyDeleteTo improve;
-layout of questionniare... its a bit chopped up. Make it clearer